Working with Quarto
Quarto
Quarto is a document format in R Studio that allows you to print off your notes, homework, and code as a word doc or other types of files. It is based on R markdown, which is a prior version of this software. You can also make websites, slide decks, and other formats to present your findings from your statistical research. For our class we’ll be using it for homework, quizzes, and tests when we’re working on problems that involve data analysis.
Palmer Penguins
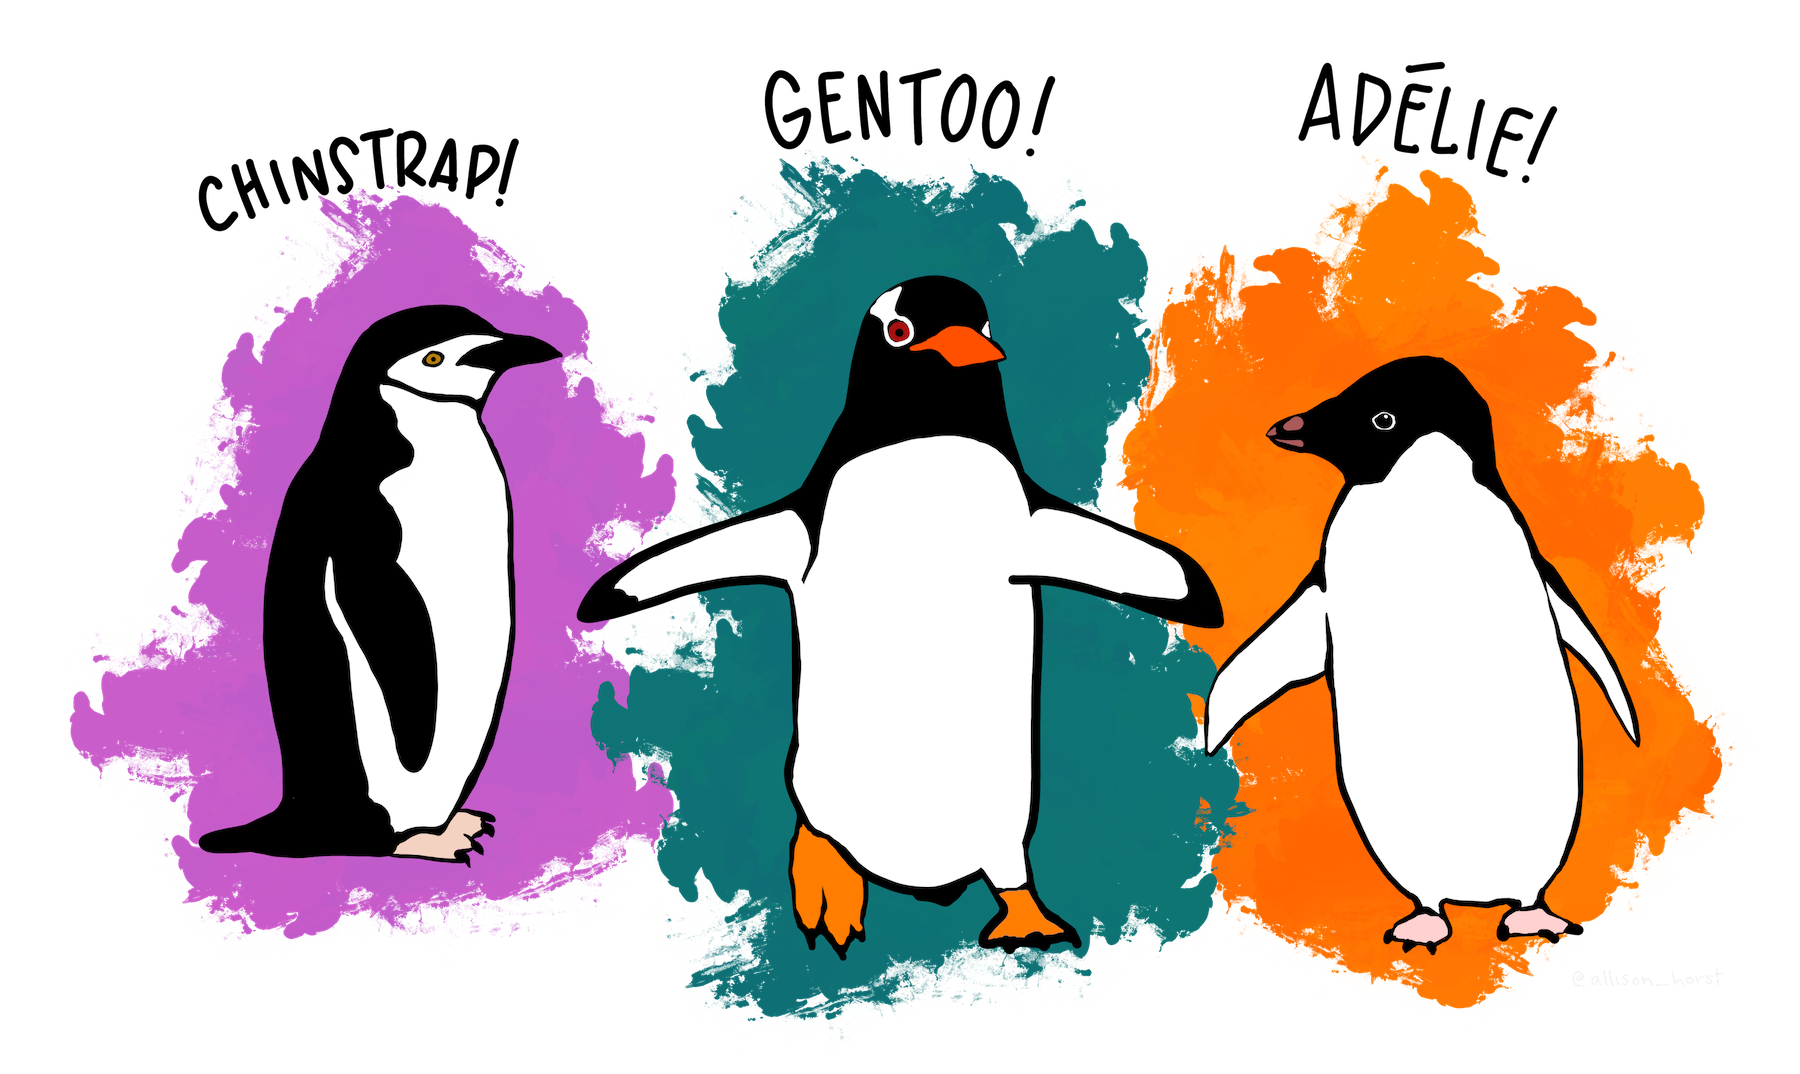
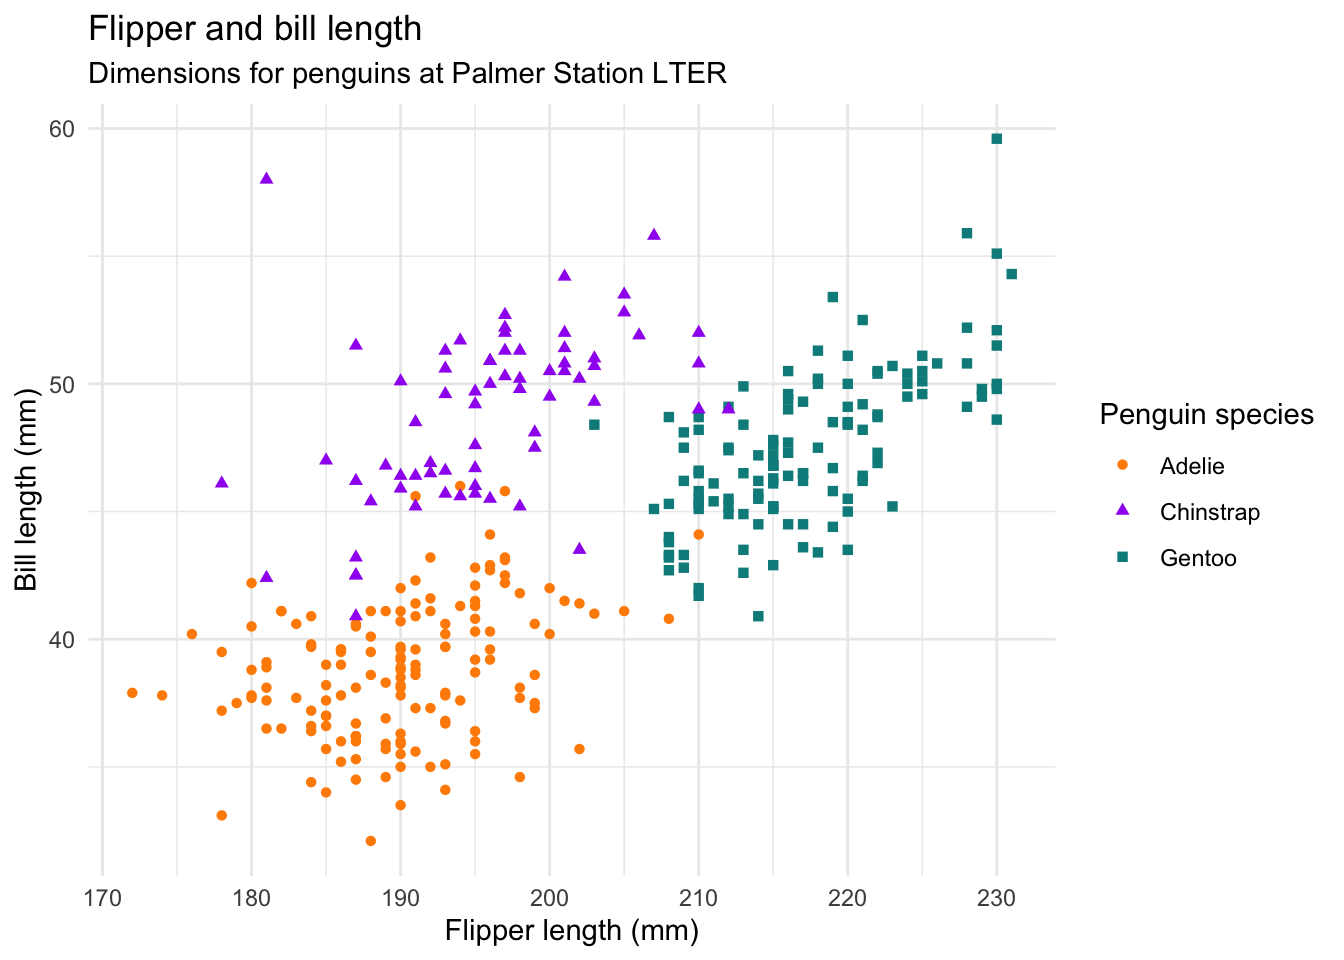
For example, the penguins data from the palmerpenguins package contains size measurements for 344 penguins from three species observed on three islands in the Palmer Archipelago, Antarctica.
Graphs
You can use the Palmer Penguins dataset to make a graph or plot of the data.
The graph below shows the relationship between flipper and bill lengths of these penguins.
Notice how Quarto runs the code to create your graph and then includes it in the output.
Here is a tutorial for Quarto using R Studio
Rendering
When you want to preview your content you hit the render button and it will show you how you are doing so far.
Code Chunks
If you go up to the insert feature in the tool bar, you can insert a cell like the one below where you can include R code. Or you can use the hot keys Option+Command+I for the Mac or in Windows Control+Alt+I
Then you can put code into the cell to run it in the document
summary(cars) speed dist
Min. : 4.0 Min. : 2.00
1st Qu.:12.0 1st Qu.: 26.00
Median :15.0 Median : 36.00
Mean :15.4 Mean : 42.98
3rd Qu.:19.0 3rd Qu.: 56.00
Max. :25.0 Max. :120.00 If you click the green arrow on the right of the cell, it will run the code chunk for you and you can check it to make sure it’s right.
How to set up an assignment
You can download the assignment template to use when you are working on your assignment. Here is how to set it up.
1. Write your YAML file
This is just the title of the assignment and your name, date, and the output, which will be a word document. This is always at the top of any Quarto document.
2. Add the r setup file
The r setup file lets you add any libraries or datasets you may need for the file. For example, you’ll need to usually add the tidyverse library for most of the assignments.
You’ll also need to add any datasets you are working with that you need to import. For example, to add SPSS files like the Album Sales Dataset you’ll need to add the haven library and then include the code to import the file.
Or if you import a .csv file, you’ll need to include the code for that as well.
If you’re not sure of where the file is, you can always import the file first and the copy the code from your console. Typically this is not included (include = FALSE), but sometimes we need to see how you set things up.
3. Add questions from the assignment.
For each question you’ll want to copy and paste the question from your homework into R Markdown.
4. Answer the question
Quarto allows you to answer the question using both the code and output. So I’ll start with a descriptive sentence or annotation about what I’m doing and then show the code and the output.
Filter dataset to mass below 250
Smaller_StarWars <- starwars |>
  filter(starwars$mass < 250)
Smaller_StarWars
# A tibble: 58 × 14
name height mass hair_color skin_color eye_color birth_year sex gender
<chr> <int> <dbl> <chr> <chr> <chr> <dbl> <chr> <chr>
1 Luke Sk… 172 77 blond fair blue 19 male mascu…
2 C-3PO 167 75 <NA> gold yellow 112 none mascu…
3 R2-D2 96 32 <NA> white, bl… red 33 none mascu…
4 Darth V… 202 136 none white yellow 41.9 male mascu…
5 Leia Or… 150 49 brown light brown 19 fema… femin…
6 Owen La… 178 120 brown, gr… light blue 52 male mascu…
7 Beru Wh… 165 75 brown light blue 47 fema… femin…
8 R5-D4 97 32 <NA> white, red red NA none mascu…
9 Biggs D… 183 84 black light brown 24 male mascu…
10 Obi-Wan… 182 77 auburn, w… fair blue-gray 57 male mascu…
# ℹ 48 more rows
# ℹ 5 more variables: homeworld <chr>, species <chr>, films <list>,
# vehicles <list>, starships <list>Create a scatterplot of mass and height
ggplot(data = Smaller_StarWars) +
  geom_point(mapping = aes(x = mass,
                           y = height))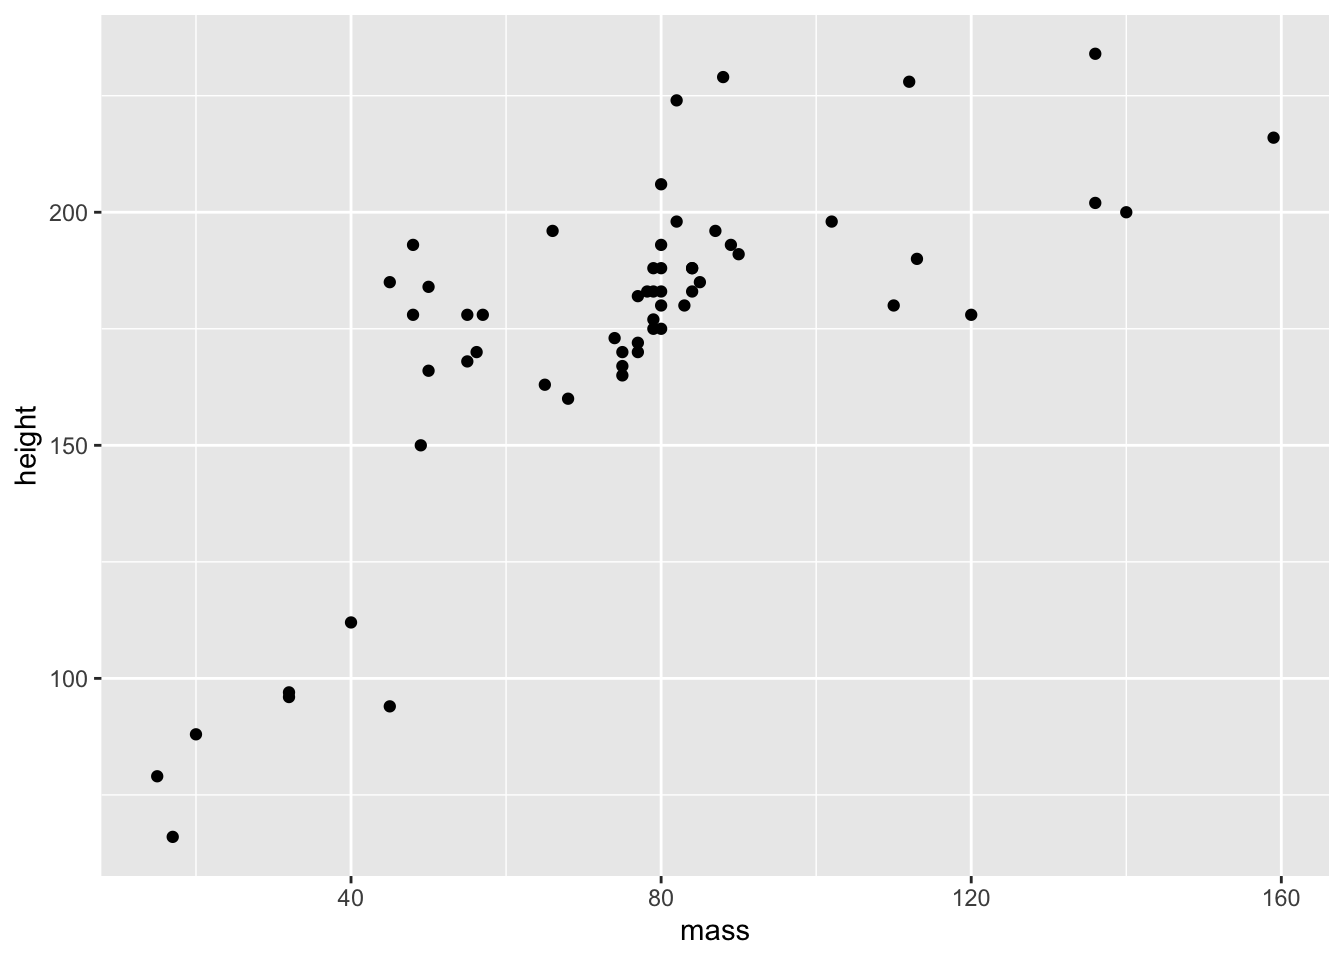
5 Render your document
After your done with your document and want to turn it in, you’ll click the render button and it will open as a word document.
The document will be saved in your working directory. The working directory is the file where all your current files are being saved. It should be listed in your console or you can type the command getwd() to find it as well.